Getting started
This introductory guide makes you create a very simple barectf YAML configuration, generate a tracer out of it, and then use it.
You need Linux for this user guide.
The steps are:
| Make sure that barectf is installed before you follow this guide. |
Write the YAML configuration file
-
Create an empty directory and
cdinto it, for example:$ cd $(mktemp --directory) -
Write the following YAML configuration file:
config.yaml# Needed YAML tag for the configuration object --- !<tag:barectf.org,2020/3/config> # Configuration's trace trace: # Type of the trace type: # Add standard field type aliases $include: - stdint.yaml - stdmisc.yaml # Native byte order is little-endian native-byte-order: little-endian # One clock type clock-types: # The Linux FS platform requires a clock type named `default` # which has a 1-GHz frequency and the `uint64_t` C type. default: frequency: 1000000000 $c-type: uint64_t # One data stream type data-stream-types: # Stream type named `default` default: # Default data stream type $is-default: true # Default clock type: `default` $default-clock-type-name: default # Two event record types event-record-types: # Event record type named `one_integer` one_integer: payload-field-type: class: structure members: # One payload member: a 32-bit signed integer field type # (`int32_t` C type) - the_integer: int32 # Event record type named `one_string` one_string: payload-field-type: class: structure members: # One payload member: a string field type # (`const char *` C type) - the_string: stringbarectf will generate two tracing functions named
barectf_trace_one_integer()andbarectf_trace_one_string()from this configuration.
Generate the files with the barectf CLI tool
-
Create a directory which will contain the CTF trace:
$ mkdir traceA CTF trace always contains a file named
metadataand one or more data stream files. barectf always generates themetadatafile while the user application writes the data stream files through the generated tracer. -
Generate the CTF metadata stream and C source files with the
barectfCLI tool:$ barectf generate --metadata-dir=trace config.yamlbarectf generatecreates:File name Description trace/metadataThe CTF metadata stream file.
It’s in the
tracedirectory because we used the--metadata-diroption.barectf.hThe generated tracer’s public C header file.
barectf-bitfield.hInternal macros for the generated tracer (included by
barectf.c).barectf.cThe generated tracer’s C source code.
Write the application source file
Write a simple application which uses the generated tracer:
app.c/* Include the Linux FS platform header */
#include "barectf-platform-linux-fs.h"
/* Include the barectf public header */
#include "barectf.h"
int main(const int argc, const char * const argv[])
{
/* Platform context */
struct barectf_platform_linux_fs_ctx *platform_ctx;
/* barectf context */
struct barectf_default_ctx *ctx;
int i;
/*
* Obtain a platform context.
*
* The platform is configured to write 512-byte packets to a data
* stream file within the `trace` directory.
*/
platform_ctx = barectf_platform_linux_fs_init(512, "trace/stream",
0, 0, 0);
/* Obtain the barectf context from the platform context */
ctx = barectf_platform_linux_fs_get_barectf_ctx(platform_ctx);
/*
* Write a `one_integer` event record which contains the number of
* command arguments.
*/
barectf_trace_one_integer(ctx, argc);
/* For each command argument */
for (i = 0; i < argc; ++i) {
/*
* Write a `one_integer` event record which contains the
* argument's index.
*/
barectf_trace_one_integer(ctx, i);
/*
* Write a `one_string` event record which contains the
* argument.
*/
barectf_trace_one_string(ctx, argv[i]);
}
/* Finalize (free) the platform context */
barectf_platform_linux_fs_fini(platform_ctx);
return 0;
}This application calls the barectf_trace_one_integer() and
barectf_trace_one_string() functions which correspond to the
one_integer and one_string event record types in
config.yaml.
Download platform source files and build the application
To build the final application, you need the Linux FS platform source files.
The Linux FS platform only exists to demonstrate barectf; a barectf user almost always writes its own platform because of the bare-metal/embedded nature of the target systems.
-
Download the Linux FS platform source files:
-
Build the application:
$ gcc -o app app.c barectf.c barectf-platform-linux-fs.c
Execute the application
Run the built application, passing a few command-line arguments:
$ ./app lorem ipsum nulla dolore consequat
This writes the CTF data
stream file trace/stream.
The trace directory is now a complete
CTF trace.
Read the CTF trace
Use Babeltrace 2 to read the resulting CTF trace:
$ babeltrace2 trace
[15:52:24.202028327] (+?.?????????) one_integer: { the_integer = 6 }
[15:52:24.202029477] (+0.000001150) one_integer: { the_integer = 0 }
[15:52:24.202029988] (+0.000000511) one_string: { the_string = "./app" }
[15:52:24.202033362] (+0.000003374) one_integer: { the_integer = 1 }
[15:52:24.202033716] (+0.000000354) one_string: { the_string = "lorem" }
[15:52:24.202034147] (+0.000000431) one_integer: { the_integer = 2 }
[15:52:24.202034465] (+0.000000318) one_string: { the_string = "ipsum" }
[15:52:24.202034812] (+0.000000347) one_integer: { the_integer = 3 }
[15:52:24.202035147] (+0.000000335) one_string: { the_string = "nulla" }
[15:52:24.202035527] (+0.000000380) one_integer: { the_integer = 4 }
[15:52:24.202035848] (+0.000000321) one_string: { the_string = "dolore" }
[15:52:24.202036175] (+0.000000327) one_integer: { the_integer = 5 }
[15:52:24.202036553] (+0.000000378) one_string: { the_string = "consequat" }
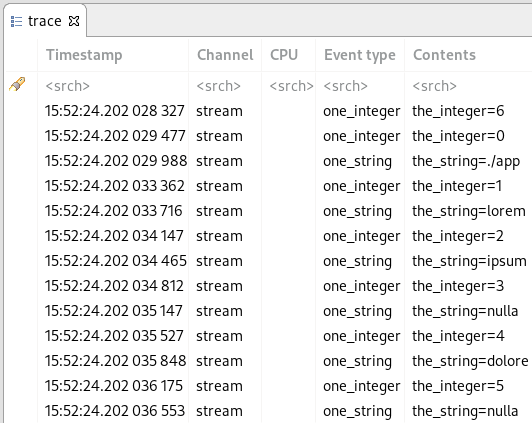
You can also open the trace with Trace Compass: